
Ethnographic Study: The City Pedestrian Experience
As an ethnographic study, we wanted to get into the minds of students on other campuses including NYC and Columbia, to get an idea of what their pedestrian experience looked like.
This was part of a New York City Design for Student Pedestrians project.
overview
This case study was a part of an Information Experience Design Master’s Program in which we paired up with the New York City’s Pedestrian Safety to help keep streets safe and clean for pedestrians, especially on college campuses. Our team of three hoped to get into the world of the every day college student pedestrian, and take a look at some solutions the city could use to keep them safe and out of harms way.
The overall project included in person observations, diary studies and interviews. We used these insights to identify how the users were feeling and what they were experiencing, and then identify a few overarching solution concepts.
Our main challenges during this process was learning to include ethnographic research tool in our toolkit, which including viewing, listening and writing observations from an inside perspective. Getting into the minds of our identified population was the challenge of this work.

Background
Client: NYC Pedestrian Safety
Duration: September 2023 - December 2023
Team: NGJ Creative
My Role: Ethnographic Researcher
Problem Statement
“What are the biggest challenges faced by students regarding pedestrian safety, especially in getting to class on time and in feeling supported by their institutions?”
The target audience for this research are graduate students between the ages of 25 and 35, who are regularly attending in person classes and navigating city streets.


Our PROCESS
We used three to four different research methods including:
General Observation
2. In-Depth Interviews
3. Diary Studies
4. Questionnaires
Tools
The tools were broadly phones & phone cameras
Participants
12 Student Participants
6 Columbia University, 6 New York University
General Observations
To start we began by noting:
Which students were using which routes and who we were interesting in interviewing
General commuting routes to and from classes
Any painpoints regarding the routes
Construction sites and general city construction
Areas we felt were unsafe. Similar to painpoints but regarding safety instead of difficulty of movement.
General Observation Results
Large Amounts of Construction
Interference between Pedestrian and Bike Lanes
Drugs, Skaters, Paraphernalia floating around
Homelessness
Easy commute from the subways to campuses
Pain-points around smaller sidewalks and overcrowding


In-Depth Interviews
We completed 12 in-depth interviews with student pedestrians, discussing their experience as pedestrians on and off campuses. Six students were from New York University, and six were from Columbia
We asked questions such as, “Where do you feel most safe on your daily commute?” “What is your favorite or least favorite part about getting to and from class?”
The goal of these interviews was to gain a in-depth understanding of student’s overall experience as pedestrians, especially related to safety and pain points in their commutes. Where could the city stand to improve and in what ways?


Interview Results
They enjoyed walking around New York.
Noted that people don’t always follow the crosswalks etc.
Street names could be hard to figure out, and that the city is very loud or noisy
Bikes are generally scarier than cars.
4/6 Columbia Students wanted the construction or scaffolding removed. It interfered with their commute.
4/6 NYU Students Noted drug use on the NYU Campus as being an issue.
9/12 Students Overall Noted that the park or surrounding areas were scarier and less safe at night.
Diary Studies
Following our interviews, we ran a full-scale competitive analysis of other museum websites in the area that we determined were most similar to the New York Transit Museum. Our analysis was broken up into a three-scale rating system, and each website was throughly combed for various types of features and additional information listed by each museum. We also gave a presentation on the results to our peers, and discussed some of the things they had noticed throughout various sites.
Ways to Improve Their Experience:
● Pedestrian-only streets
● Enhanced information around campus security & increased
presence
● Healing or addressing homelessness
● Focus on motorized bikes and their routes
●. Addressing rampant & open drug use
Diary Studies Results
These Students Initially Noted:
●. Crowding around crosswalks and mixed crossing signals
● Construction detours
●. Lack of police presence in stressful areas
●. They appreciated jaywalking, as they could get to class faster & were late
●. Being pestered by solicitors in the park was frustrating
Questionnaires/Surveys
For additional information, we sent out a series of surveys to the participants asking what their main concerns on campus were, scaling them from 1-10. Once we had identified in our research some of the overarching concerns, this was used to gauge which were most pressing to our target audience.
“There are so many people doing drugs or smoking, it’s frustrating”
“I’m always Avoiding motorized bikes in the bike lane”
“The homeless population is a big concern”
“The Construction has made me run late on several occasions”
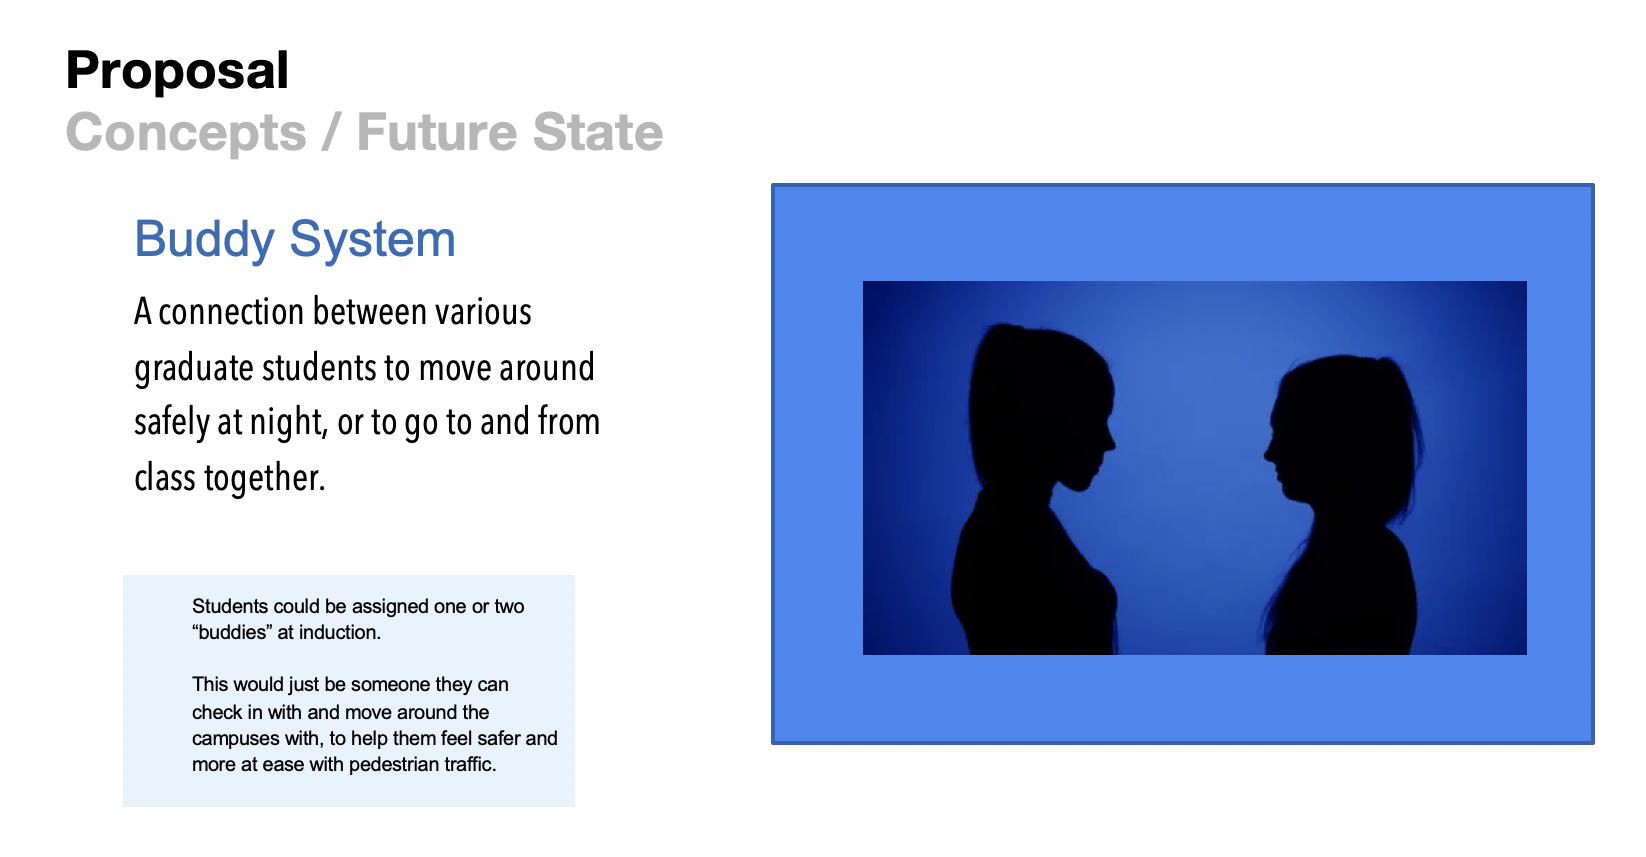
Additional Proposed solutions


Next Steps
The Project concluded with our recommendations for a few features the city or schools could implement to improve campus pedestrian experiences, and a presentation of our findings to the City Pedestrian Safety Committee. As they move forward with their changes, it was good for them to note which areas needed improvement and what the biggest issues with the pedestrian experience were.